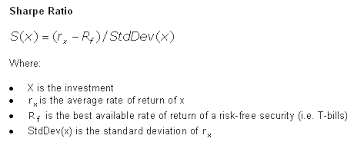
Take a fresh look at the Sharpe Ratio .
What is the 'Sharpe Ratio'
The Sharpe Ratio is a measure for calculating risk-adjusted return, and this ratio has become the industry standard for such calculations. It was developed by Nobel laureate William F. Sharpe. The Sharpe ratio is the average return earned in excess of the risk-free rate per unit of volatility or total risk. Subtracting the risk-free rate from the mean return, the performance associated with risk-taking activities can be isolated. One intuition of this calculation is that a portfolio engaging in “zero risk” investment, such as the purchase of U.S. Treasury bills (for which the expected return is the risk-free rate), has a Sharpe ratio of exactly zero. Generally, the greater the value of the Sharpe ratio, the more attractive the risk-adjusted return.
Next Up
BREAKING DOWN 'Sharpe Ratio'
The Sharpe ratio has become the most widely used method for calculating risk-adjusted return; however, it can be inaccurate when applied to portfolios or assets that do not have a normal distribution of expected returns. Many assets have a high degree of kurtosis ('fat tails') or negative skewness. The Sharp ratio also tends to fail when analyzing portfolios with significant non-linear risks, such as options or warrants. Alternative risk-adjusted return methodologies have emerged over the years, including the Sortino Ratio, Return Over Maximum Drawdown (RoMaD), and the Treynor Ratio.
Modern Portfolio Theory states that adding assets to a diversified portfolio that have correlations of less than one with each other can decrease portfolio risk without sacrificing return. Such diversification will serve to increase the Sharpe ratio of a portfolio.
Sharpe ratio = (Mean portfolio return − Risk-free rate)/Standard deviation of portfolio return
The ex-ante Sharpe ratio formula uses expected returns while the ex-post Sharpe ratio uses realized returns.
Applications of the Sharpe Ratio
The Sharpe ratio is often used to compare the change in a portfolio's overall risk-return characteristics when a new asset or asset class is added to it. For example, a portfolio manager is considering adding a hedge fund allocation to his existing 50/50 investment portfolio of stocks which has a Sharpe ratio of 0.67. If the new portfolio's allocation is 40/40/20 stocks, bonds and a diversified hedge fund allocation (perhaps a fund of funds), the Sharpe ratio increases to 0.87. This indicates that although the hedge fund investment is risky as a standalone exposure, it actually improves the risk-return characteristic of the combined portfolio, and thus adds a diversification benefit. If the addition of the new investment lowered the Sharpe ratio, it should not be added to the portfolio.
The Sharpe ratio can also help explain whether a portfolio's excess returns are due to smart investment decisions or a result of too much risk. Although one portfolio or fund can enjoy higher returns than its peers, it is only a good investment if those higher returns do not come with an excess of additional risk. The greater a portfolio's Sharpe ratio, the better its risk-adjusted performance has been. A negative Sharpe ratio indicates that a risk-less asset would perform better than the security being analyzed.
Criticisms and Alternatives
The Sharpe ratio uses the standard deviation of returns in the denominator as its proxy of total portfolio risk, which assumes that returns are normally distributed. Evidence has shown that returns on financial assets tend to deviate from a normal distribution and may make interpretations of the Sharpe ratio misleading.
A variation of the Sharpe ratio is the Sortino ratio, which removes the effects of upward price movements on standard deviation to measure only return against downward price volatility and uses the semivariance in the denominator. The Treynor ratio uses systematic risk, or beta (β) instead of standard deviation as the risk measure in the denominator.
The Sharpe ratio can also be "gamed" by hedge funds or portfolio managers seeking to boost their apparent risk-adjusted returns history. This can be done by:
- Lengthening the measurement interval: This will result in a lower estimate of volatility. For example, the annualized standard deviation of daily returns is generally higher than of weekly returns, which is, in turn, higher than of monthly returns.
- Compounding the monthly returns but calculating the standard deviation from the not compounded monthly returns.
- Writing out-of-the-money puts and calls on a portfolio: This strategy can potentially increase the return by collecting the option premium without paying off for several years. Strategies that involve taking on default risk, liquidity risk, or other forms of catastrophe risk have the same ability to report an upwardly biased Sharpe ratio. (An example is the Sharpe ratios of market-neutral hedge funds before and after the 1998 liquidity crisis.)
- Smoothing of returns: Using certain derivative structures, infrequent marking to market of illiquid assets, or using pricing models that understate monthly gains or losses can reduce reported volatility.
- Eliminating extreme returns: Because such returns increase the reported standard deviation of a hedge fund, a manager may chose to attempt to eliminate the best and the worst monthly returns each year to reduce the standard deviation.

Comments
Post a Comment